A Step-by-Step Guide to STRUCTURE
By: Ava Leaphart (Trinity '25)
March 2023
Why use STRUCTURE?
If you’re reading this, you’ve likely spent a bit of time observing a population of a given species, and you’re pretty sure there are some underlying discrepancies between them, but you’re unsure of how to investigate it further. Maybe you have a population of monkeys where some seem to roam lower to the ground while others jump between canopies, or possibly a group of fish that all come back to the same river in spring, but some a few weeks earlier than others. In these cases, and many more, an amazing starting tool to see whether or not these differences you observe are more than just behavioral is STRUCTURE, a friendly program that uses genetic variance to tell you if there are subpopulations present.
What is STRUCTURE?
In the most rudimentary of terms, STRUCTURE is a program that analyzes genetic variation by taking in a group of individual samples, and predicting how many subgroups exist and which individuals belong to each subgroup. If you want a more in depth description, I’d recommend checking out this article or reading through the paper where it was developed here.
Tutorial Materials
Note: The hardest part of STRUCTURE is inputting data, after that it is really simple!
Pre-reqs to using STRUCTURE
-
Genotypic data in VCF/STRUCTURE file format
-
If you need to convert your file to VCF format, here are detailed instructions
-
I recommend working through the “Inputting Data” section with this file open, so you can edit it if needed.
-
Inputting Data
-
*If your file is in VCF file format*, open PGDSpider and convert your VCF to STRUCTURE.
-
Create a new folder in your files to contain your run information.
-
Open STRUCTURE -> File -> New Project -> give it a unique name, select the folder made above as output directory, and choose your data file.

-
In the next window, input your number of individuals, their ploidy, the number of loci you have, and a missing data value (this is individual to your data set).
-
In the following window, select any of the options that apply, usually “Row of Marker Names” is one.
-
Again, select any options that apply, usually “Individual ID for Each Individual” and “Putative Pop Origin for Each Individual” are selected.
-
Click proceed and your data should load.
-
If not, now is the time to view your data file and make sure what you have selected aligns with what your data file shows.
-

Setting Run Parameter
The purpose of this is to tell STRUCTURE how intensely you want it to try to create these groups, the higher the values, the more times it will run simulations to group them.
-
Parameter set -> New -> Set your length of burn in period and number of MCMC repetitions.
-
The MCMC (Monte Carlo Markhov Chain) basically assigns individuals randomly to a group, finds the variation frequency between groups, and then repeats the process building off the previous assignment to approach a constant variation frequency.
-
The burn in period is just a repetition of the MCMC many times in an attempt to find the most accurate individual assignments and frequency estimates.
-
I would also recommend higher values for both, mine is just lower for the example.
-
-
Name and save your parameter set.
Running STRUCTURE
-
Project -> Start a job -> Select run parameter -> Set your K (project dependent) and your number of iterations (project dependent) -> Start.
-
K just means the number of subpopulations in your dataset. I’d recommend setting your K range to a few values less than and greater than what you expect it to be.
-
I would also recommend a higher number of iterations, mine is lower just for example.
-

Viewing Results
-
On the left hand side can see every run STRUCTURE did, select the run you want -> Bar plot -> Group by pop id to visualize the predicted grouping.
-
The bars along the bottom represent one individual, filled with their proportion of similarity to each group.
-
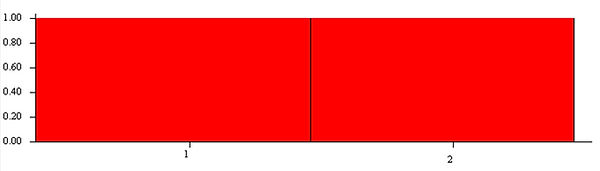
K= 1
K= 2

K= 3

Just visually, you can see the clearest group membership is when K=2, which is exactly the amount of populations the article found.

Next Steps:
Structure Harvester quickly analyzes your STRUCTURE runs and allows you to save the analysis into a neat zip file. It also lets you see the calculated deltaK which calculates the most probable K value by comparing the probability changes from each K run.
Structure Harvester
-
Go to your file containing all your STRUCTURE runs (Results) -> Convert the file to .zip file format.
-
Open Structure Harvester -> Upload your .zip file and harvest -> Find the highlighted deltaK value.
-
Go back to STRUCTURE and to one of those K runs (or to the Clumpp file in Structure Harvester) -> Save the visual or use that Clumpp file to combine all of the K runs for that K value into one visual.
-
Download tar.gz file to access later -> Extract file to view what Structure Harvester created.

Additional Resources
-
Here is a helpful video that includes more visuals
Current Application
On this Bass team, STRUCTURE was one of our first steps to determining whether there is supporting evidence for a third subpopulation of T. truncatus dolphins living in the western North Atlantic Ocean. Included below are three separate runs at K=3 on the 119 samples we have collected over the years:

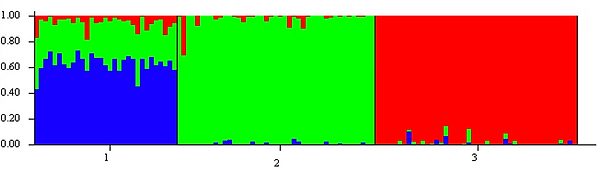

As you can see, groups two and three are strongly, genetically homogenous amongst themselves, but group one each time shows both admixture and the presence of a different color at a high rate, making it a very interesting group to try to study in an attempt to piece its history together. It is worth noting that the colors between runs are randomly generated, so green does not signify the same population in all three runs. This is the reason tools like Clumpp exist to standardize the colors for easier interpretation.
Citations
Ali, Mohsin. “A Step by Step Tutorial to Detect Population Structure Using Structure Software.” YouTube, YouTube, 19 June 2021, https://www.youtube.com/watch?v=ch-VAwKHmVg.
“Download Structure 2.3.4.” Structure Software: V. 2.3.4, https://web.stanford.edu/group/pritchardlab/structure_software/release_versions/v2.3.4/html/structure.html.
Earl, Dent. “Structure Harvester.” Structure Harvester, https://taylor0.biology.ucla.edu/structureHarvester/.
FALUSH, DANIEL, et al. “Inference of Population Structure Using Multilocus Genotype Data: Dominant Markers and Null Alleles.” Molecular Ecology Notes, vol. 7, no. 4, 2007, pp. 574–578., https://doi.org/10.1111/j.1471-8286.2007.01758.x.
Leischer, Heidi. “PGDSpider.” PGDSpider Version 2.1.1.5, http://www.cmpg.unibe.ch/software/PGDSpider/.
Porras-Hurtado, Liliana, et al. “An Overview of Structure: Applications, Parameter Settings, and Supporting Software.” Frontiers, Frontiers, 14 May 2013, https://www.frontiersin.org/articles/10.3389/fgene.2013.00098/full.
Pritchard, Jonathan, et al. “Association Mapping in Structured Populations.” The American Journal of Human Genetics, Cell Press, 9 Jan. 2008, https://www.sciencedirect.com/science/article/pii/S0002929707624422?via%3Dihub.
“Structure Software.” Structure Software for Population Genetics Inference: V1.0, https://web.stanford.edu/group/pritchardlab/software/structure-data_v.2.3.1.html.
“Variant Call Format (VCF) Version 4.2 Specification.” 2022, https://doi.org/10.1201/9781315154770-13. Accessed 29 Mar. 2023.